
What Is Reputation Analytics?
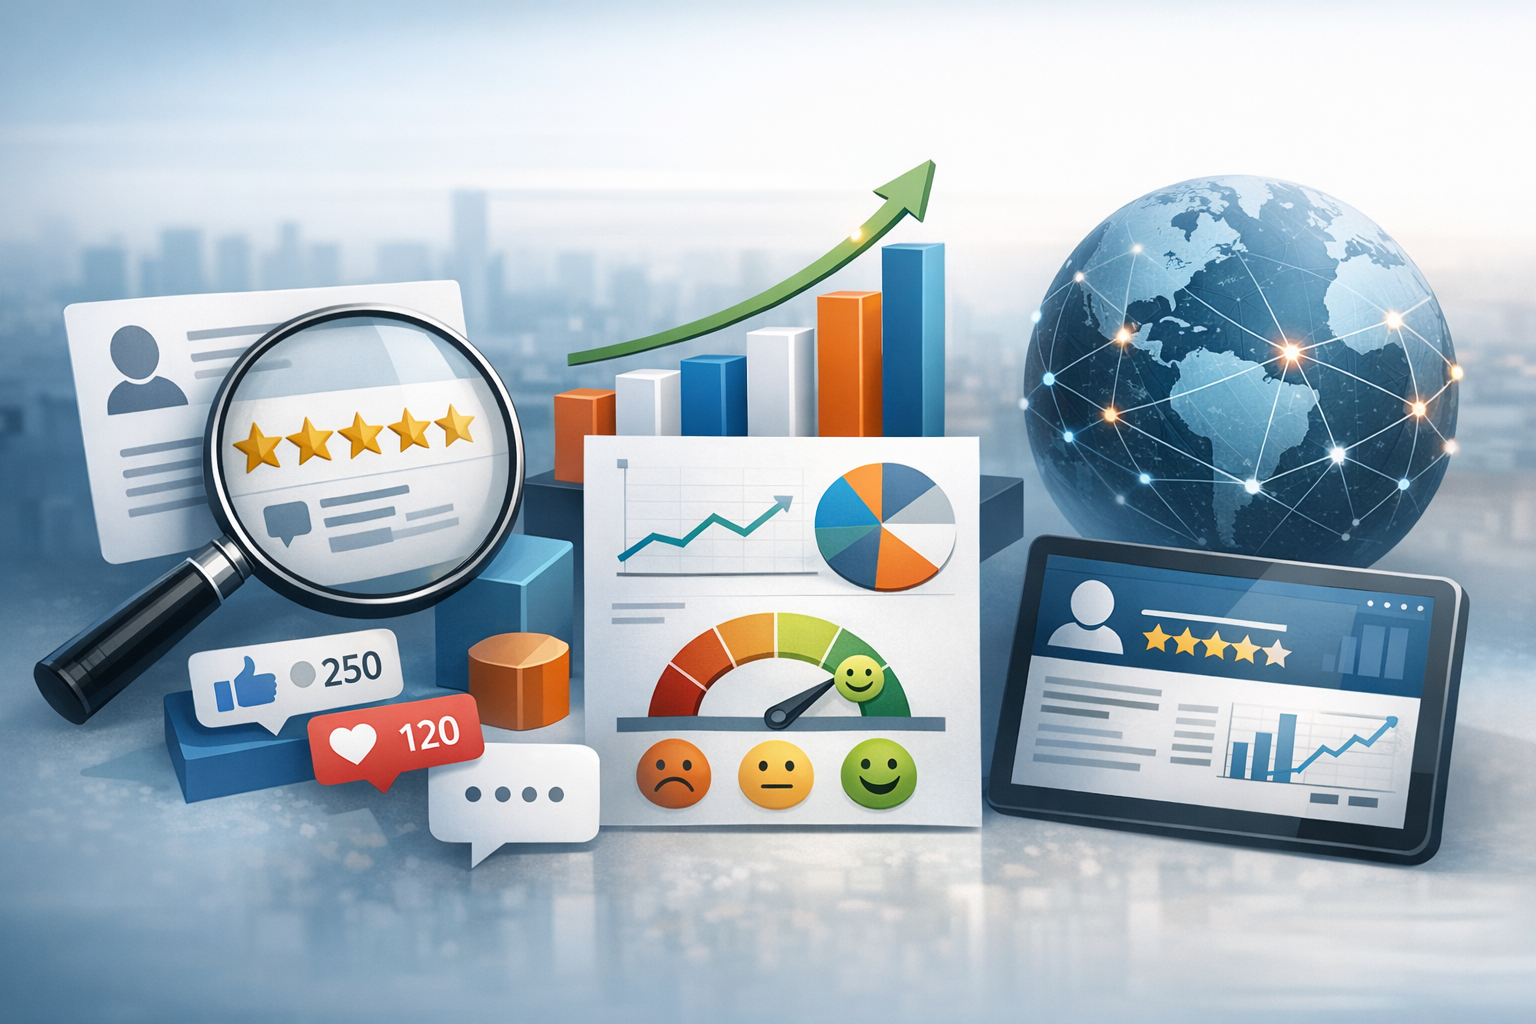
Reputation analytics is the practice of collecting, analyzing, and interpreting data about how people perceive your brand, organization, or public figure across digital and offline channels. It combines quantitative signals (review ratings, sentiment scores, share of voice) with qualitative insights (common complaints, trust drivers, recurring praise) to help you understand what’s shaping your reputation—and what to do about it.
Unlike basic monitoring (e.g., seeing that someone mentioned your brand), reputation analytics focuses on meaning and impact: Are mentions positive or negative? Which themes are driving the conversation? Is trust increasing over time? Are issues isolated or spreading? The goal is to move from reactive reputation management to proactive decision-making based on data.
Why Reputation Analytics Matters
Your reputation influences revenue, recruiting, partnerships, and resilience during crises. A strong reputation can lower customer acquisition costs, improve conversion rates, and boost lifetime value. A weak or unstable reputation creates friction—customers hesitate, candidates decline offers, and small problems escalate quickly.
Reputation analytics matters because it helps you:
- Detect issues early before they become full-blown crises.
- Prioritize improvements based on what actually drives sentiment and trust.
- Measure the ROI of PR, customer experience, and community efforts.
- Benchmark performance against competitors and industry standards.
- Align teams (marketing, customer success, HR, leadership) around shared metrics.
Core Data Sources for Reputation Analytics
Effective reputation analytics blends multiple data sources to provide a complete picture. Relying on one channel—like social media—can mislead you, since vocal audiences may not represent your broader customer base.
Online Reviews and Ratings
Review platforms (Google, Yelp, G2, Trustpilot, industry-specific sites) are often the most direct window into customer experience. Key signals include:
- Average rating and distribution (not just the mean).
- Review velocity (how often new reviews appear).
- Topic patterns (e.g., “shipping delays,” “billing confusion,” “friendly staff”).
- Response rate and response time to reviews.
Social Media and Community Conversations
Social platforms and community forums reveal real-time reactions and emerging narratives. Sources can include X, Instagram, TikTok, LinkedIn, Reddit, Discord, and niche forums. Social data is especially useful for tracking:
- Sentiment shifts after announcements or incidents.
- Influencer impact and high-reach amplification.
- Recurring themes in questions, complaints, and praise.
News Coverage and PR Mentions
Media coverage strongly shapes public perception, particularly for regulated industries and high-consideration purchases. Track:
- Share of voice versus competitors.
- Message pull-through (are key messages being repeated accurately?).
- Tonality and spokesperson visibility.
Customer Support and Feedback Data
Your support tickets, chat logs, call transcripts, NPS/CSAT surveys, and product feedback are reputation data—even if they aren’t public. They often reveal the root causes behind negative reviews and social complaints. Look for:
- Top contact reasons and how they change over time.
- Resolution time and escalation rates.
- Sentiment and effort (how difficult it was for customers to get help).
Key Metrics Used in Reputation Analytics
Reputation is multi-dimensional, so you’ll want a balanced scorecard rather than one “magic number.” Here are the most common metrics and what they tell you.
Sentiment Analysis
Sentiment analysis classifies mentions as positive, negative, or neutral (and sometimes adds emotion categories like anger or delight). It’s valuable for spotting trends, but it should be paired with human review—especially for sarcasm, slang, and industry-specific language.
Tip: Track sentiment by channel (reviews vs. social vs. news) and by topic (pricing, support, quality) to pinpoint what’s driving changes.
Share of Voice (SOV)
Share of voice measures how much of the conversation in your category is about your brand compared to competitors. SOV is most useful when combined with sentiment:
- High SOV + positive sentiment suggests strong brand leadership.
- High SOV + negative sentiment can signal a reputational risk or crisis.
- Low SOV may indicate limited visibility or weaker PR reach.
Review Volume, Velocity, and Recency
Ratings alone don’t tell the full story. A 4.7 average with two reviews is less persuasive than a 4.4 with hundreds. Track:
- Volume (how many reviews you have).
- Velocity (how quickly reviews are coming in).
- Recency (how current your reputation appears to prospective customers).
Net Promoter Score (NPS) and Customer Satisfaction (CSAT)
NPS and CSAT can act as early indicators of reputation shifts—especially when paired with open-text responses. Monitor:
- NPS trend over time and by segment (product line, region, customer type).
- Driver analysis (what reasons promoters and detractors give).
- Correlation with churn, renewals, and review sentiment.
Trust and Risk Signals
Depending on your industry, “trust” may be the core of your reputation. Consider tracking signals such as:
- Policy transparency and complaint rates (returns, billing, cancellations).
- Security and privacy mentions (breach-related keywords, data concerns).
- Compliance and safety flags (for healthcare, finance, travel, etc.).
How Reputation Analytics Works: A Practical Process
Reputation analytics is most effective when it’s run as a repeatable cycle, not a one-off report. Here’s a practical approach you can adapt to your organization.
1) Define Goals and Stakeholders
Start by clarifying what you’re trying to achieve. Are you aiming to increase review ratings, reduce negative sentiment after a product change, improve employer brand perception, or strengthen crisis readiness? Map stakeholders across departments—marketing, PR, customer success, HR, legal, and leadership—so insights turn into action.
2) Collect and Normalize Data
Aggregate data from reviews, social, news, and internal systems. Then normalize it so comparisons are meaningful:
- Unify brand naming variations and product names.
- De-duplicate mentions and remove spam.
- Standardize timestamps, regions, and categories.
3) Classify Themes and Drivers
Beyond sentiment, classify what people are talking about. Common categories include product quality, pricing, shipping, customer support, ethics, and leadership. Theme tagging (manual, automated, or hybrid) helps you identify the drivers behind reputation changes.
4) Analyze Trends and Correlations
Look for patterns over time and connect reputation signals to business outcomes:
- Did a spike in negative sentiment precede churn?
- Do certain locations have consistently lower ratings?
- Did a PR campaign increase positive SOV in target publications?
Trend analysis is where reputation analytics becomes strategic—helping you forecast risk and prioritize investments.
5) Act, Respond, and Measure Impact
Insights are only valuable if you act on them. Build a response and improvement plan, then measure impact with a clear before-and-after view. Examples:
- Update onboarding content to reduce “confusing setup” complaints.
- Improve staffing during peak times to cut response delays.
- Clarify pricing pages to reduce billing disputes and mistrust.
Tools and Techniques to Power Reputation Analytics
You can run reputation analytics with anything from spreadsheets to advanced platforms, depending on volume and complexity. The best setup is the one you can sustain consistently.
Dashboards and Reporting
Dashboards bring your core metrics into one place. Aim for a mix of:
- Executive view: sentiment trend, SOV, average rating, major risks.
- Operational view: themes by volume, response times, top negative drivers.
- Channel view: reviews vs. social vs. news performance.
Keep reports focused: show trends, key drivers, and recommended actions—avoid overwhelming stakeholders with raw data.
Text Analytics and Topic Modeling
Text analytics helps you extract meaning from unstructured feedback (reviews, tickets, comments). Topic modeling and keyword clustering can surface unexpected themes, while more controlled taxonomies keep reporting stable over time. Many teams succeed with a hybrid approach: automated clustering plus periodic human validation.
Competitive Benchmarking
Benchmarking turns internal numbers into context. Compare your brand with competitors on:
- Average rating and review volume
- Sentiment by topic (e.g., support, value, reliability)
- Media share of voice and message pull-through
The goal isn’t to copy competitors—it’s to identify gaps, opportunities, and differentiators you can own.
Common Challenges (and How to Avoid Them)
Reputation analytics can go off track when teams focus on the wrong signals or fail to connect insights to action. Here are common pitfalls and how to address them.
Over-Reliance on Automated Sentiment
Automated sentiment can misread sarcasm or context, especially in social posts. Use sampling and human review for high-impact events, and treat sentiment as a directional signal—not absolute truth.
Measuring What’s Easy, Not What Matters
It’s tempting to chase vanity metrics (follower counts, raw mention volume). Instead, anchor your measurement to outcomes: conversion rates, churn, customer effort, and issue resolution times.
Ignoring Channel Differences
A complaint on a review site may reflect a genuine customer experience; a viral post may reflect broader public emotion. Segment your analysis by channel, audience, and geography so you respond appropriately.
Lack of Ownership and Follow-Through
Reputation is cross-functional. Assign clear owners for themes (e.g., billing issues go to finance/ops; product bugs go to engineering) and set timelines. Close the loop by measuring whether actions reduced negative mentions or improved ratings.
Getting Started: A Simple Reputation Analytics Framework
If you’re starting from scratch, keep it simple and build momentum:
- Choose 3–5 core metrics (e.g., average rating, review volume, sentiment trend, SOV, top negative themes).
- Set a baseline for the last 90 days and identify your top 3 drivers of negativity and positivity.
- Create a monthly cadence (one report, one cross-team meeting, one improvement sprint).
- Track outcomes (did the change reduce complaints, improve CSAT, increase conversions?).
Consistency beats complexity. A repeatable system that drives action will outperform an elaborate dashboard that no one uses.
Conclusion
Reputation analytics turns scattered feedback and public perception into measurable insights you can act on. By combining data from reviews, social conversations, media coverage, and customer support—and tracking the right metrics—you can identify what’s shaping trust, address issues before they escalate, and steadily improve how your brand is perceived. Start with a clear goal, build a simple measurement framework, and commit to a regular cycle of analysis and action.